Data mining and interpretation take centre stage when concerning smooth deployment of outliers across the channels. Outliers, defined in simple words, are the data points that deviate significantly from the norm or the general data pattern. Ahead of misleading information and computational errors are some of the drawbacks that can be enumerated for an Outlier. This dramatic divergence from the overall data distribution patterns reveals massive Outliers.
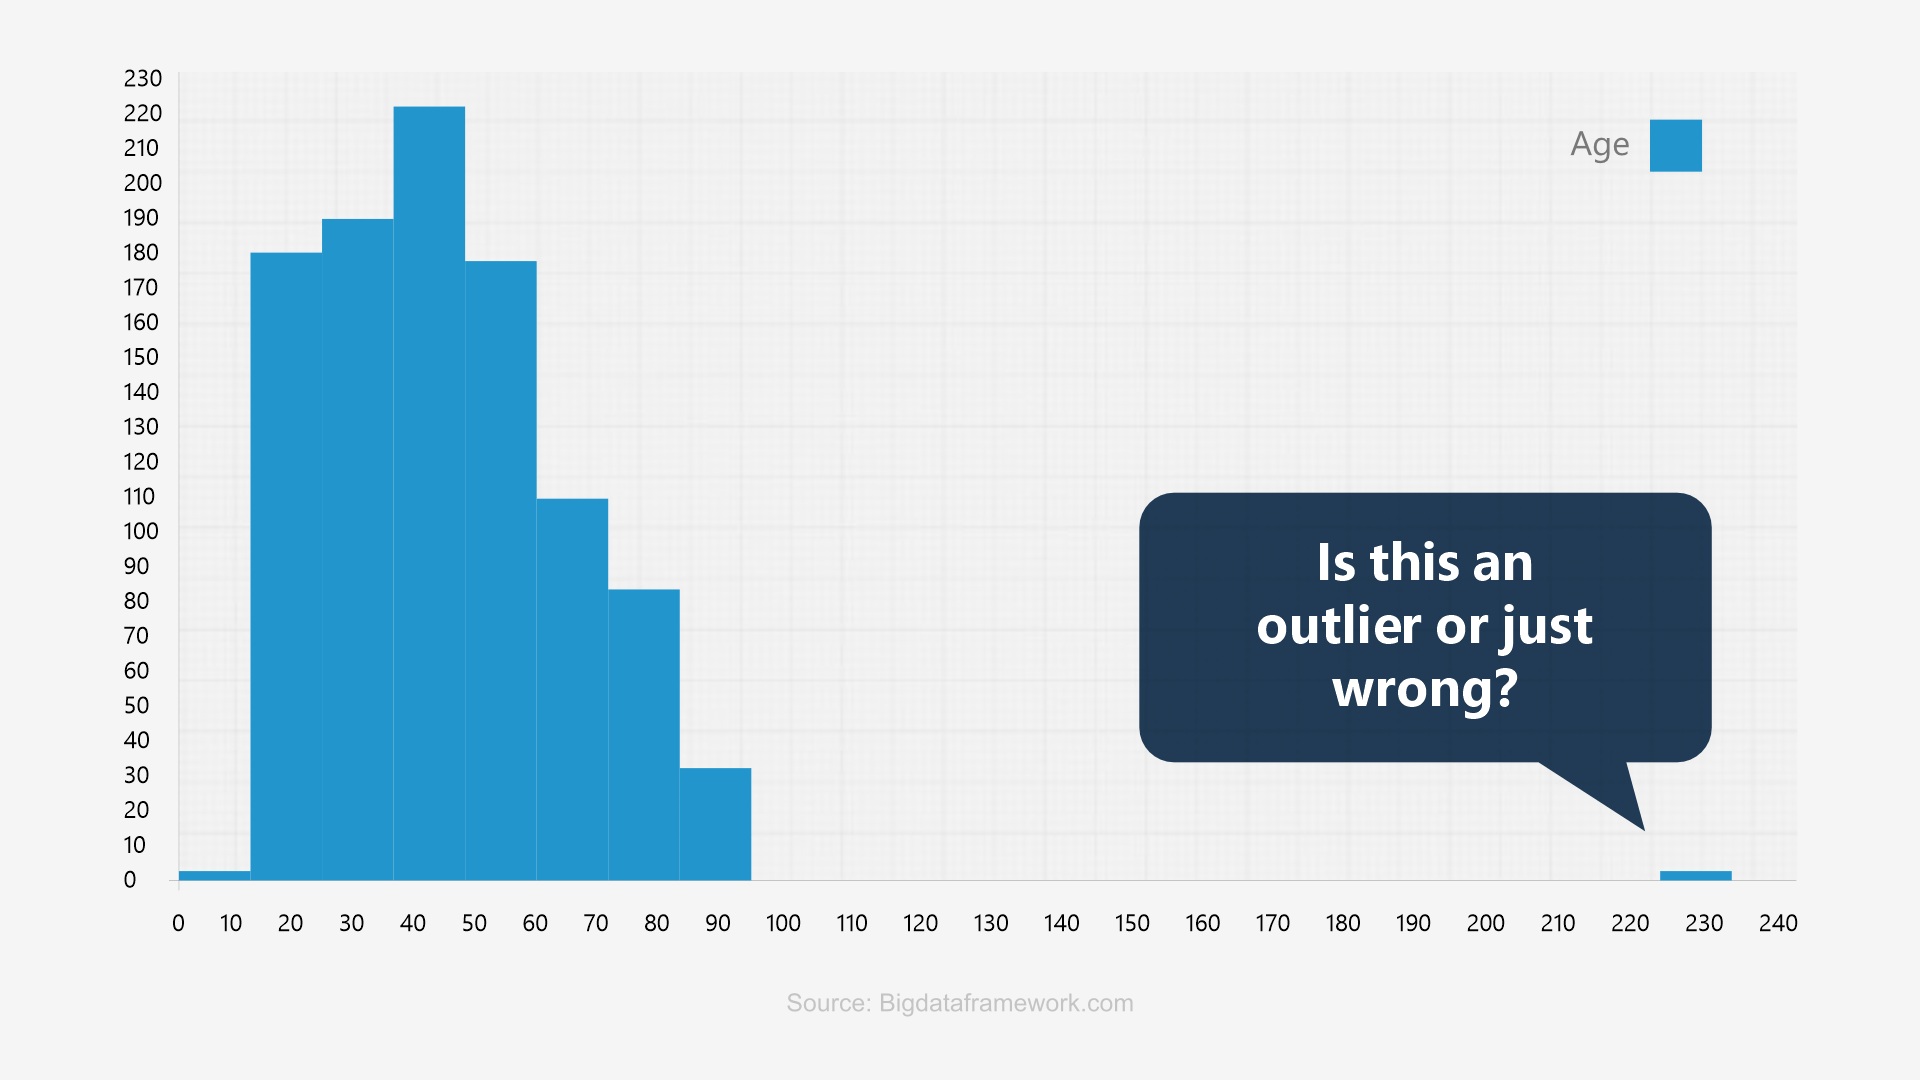
The image above showcases an exact look of an outlier on the bar graph visualization. The process of robust data analysis is incomplete without aiming at the outliers. Outlier analysis is a critical step in data interpretation and forms the basis of effective data analysis in diverse fields, including finance, healthcare, cybersecurity, etc.
The Big Deal about Outliers- Impact on Data-driven Decision-making
Outliers, the data points that significantly deviate from the norm, can distort statistical analyses and lead to inaccurate data-driven decisions. Let us understand in depth:
Understanding these key areas and working to build a robust outlier identification and handling pathway is a must to resolve potential outliers that may result in inaccurate data-driven decision-making.
How are Outliers different from Anomalies?
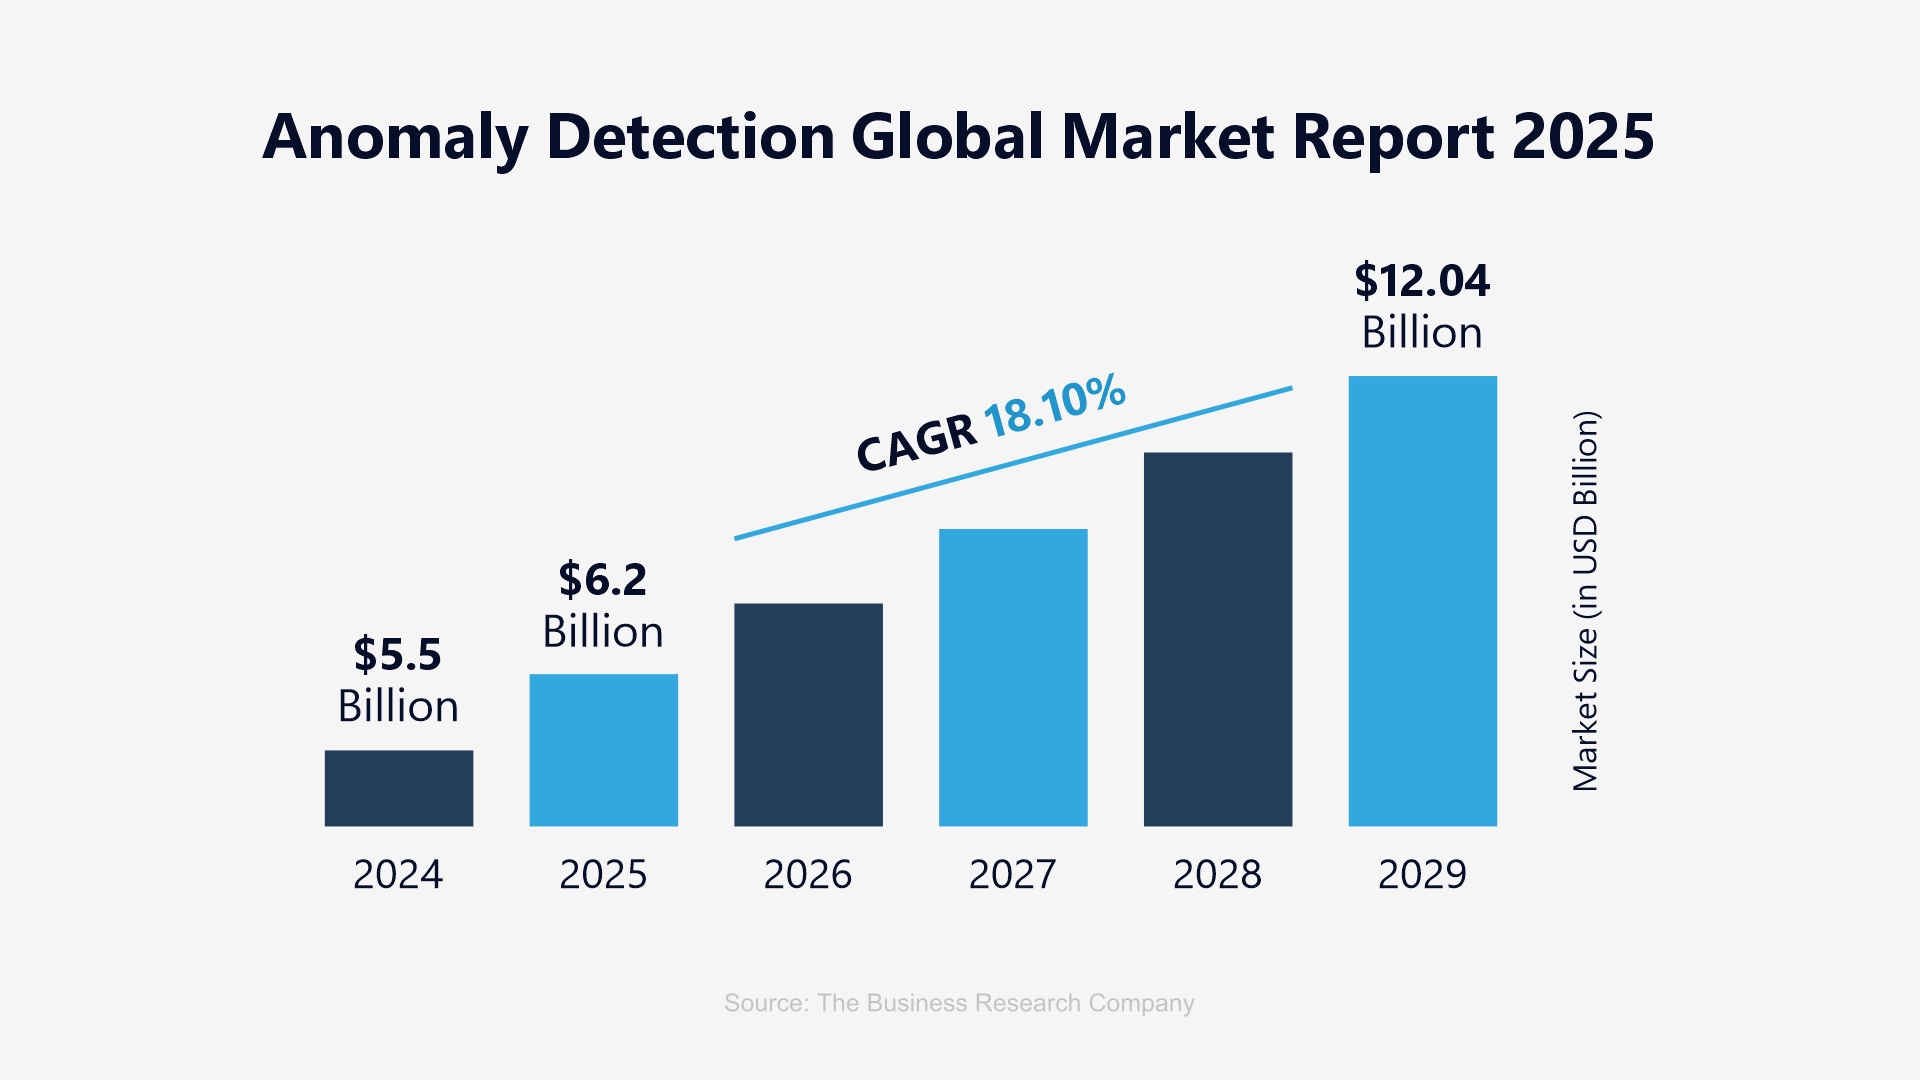

While often used interchangeably, outliers are simple data points that deviate drastically from the given path or norm. Whereas an anomaly are patterns or instances that deviate significantly from the designated ‘normal’ behavior. The global market size reflected above clearly indicates an astounding progression in the way it is going to expand over the years to follow. A quick differentiator shall help bring the striking differences between the two.
|
Parameters |
Outliers |
Anomaly |
|
Cause |
They occur due to variability in the measurement, an indication of novel data, or due to experimental error |
They indicate critical incidents, such as technical glitches, or potential opportunities. |
|
Focus |
Values of individual data points |
Identifying patterns that deviate |
|
Use case |
A student who scored a significantly higher or lower than average score. |
Sudden spike in traffic from a specific IP address in network traffic dataset |
Why does Outlier Detection Matter?
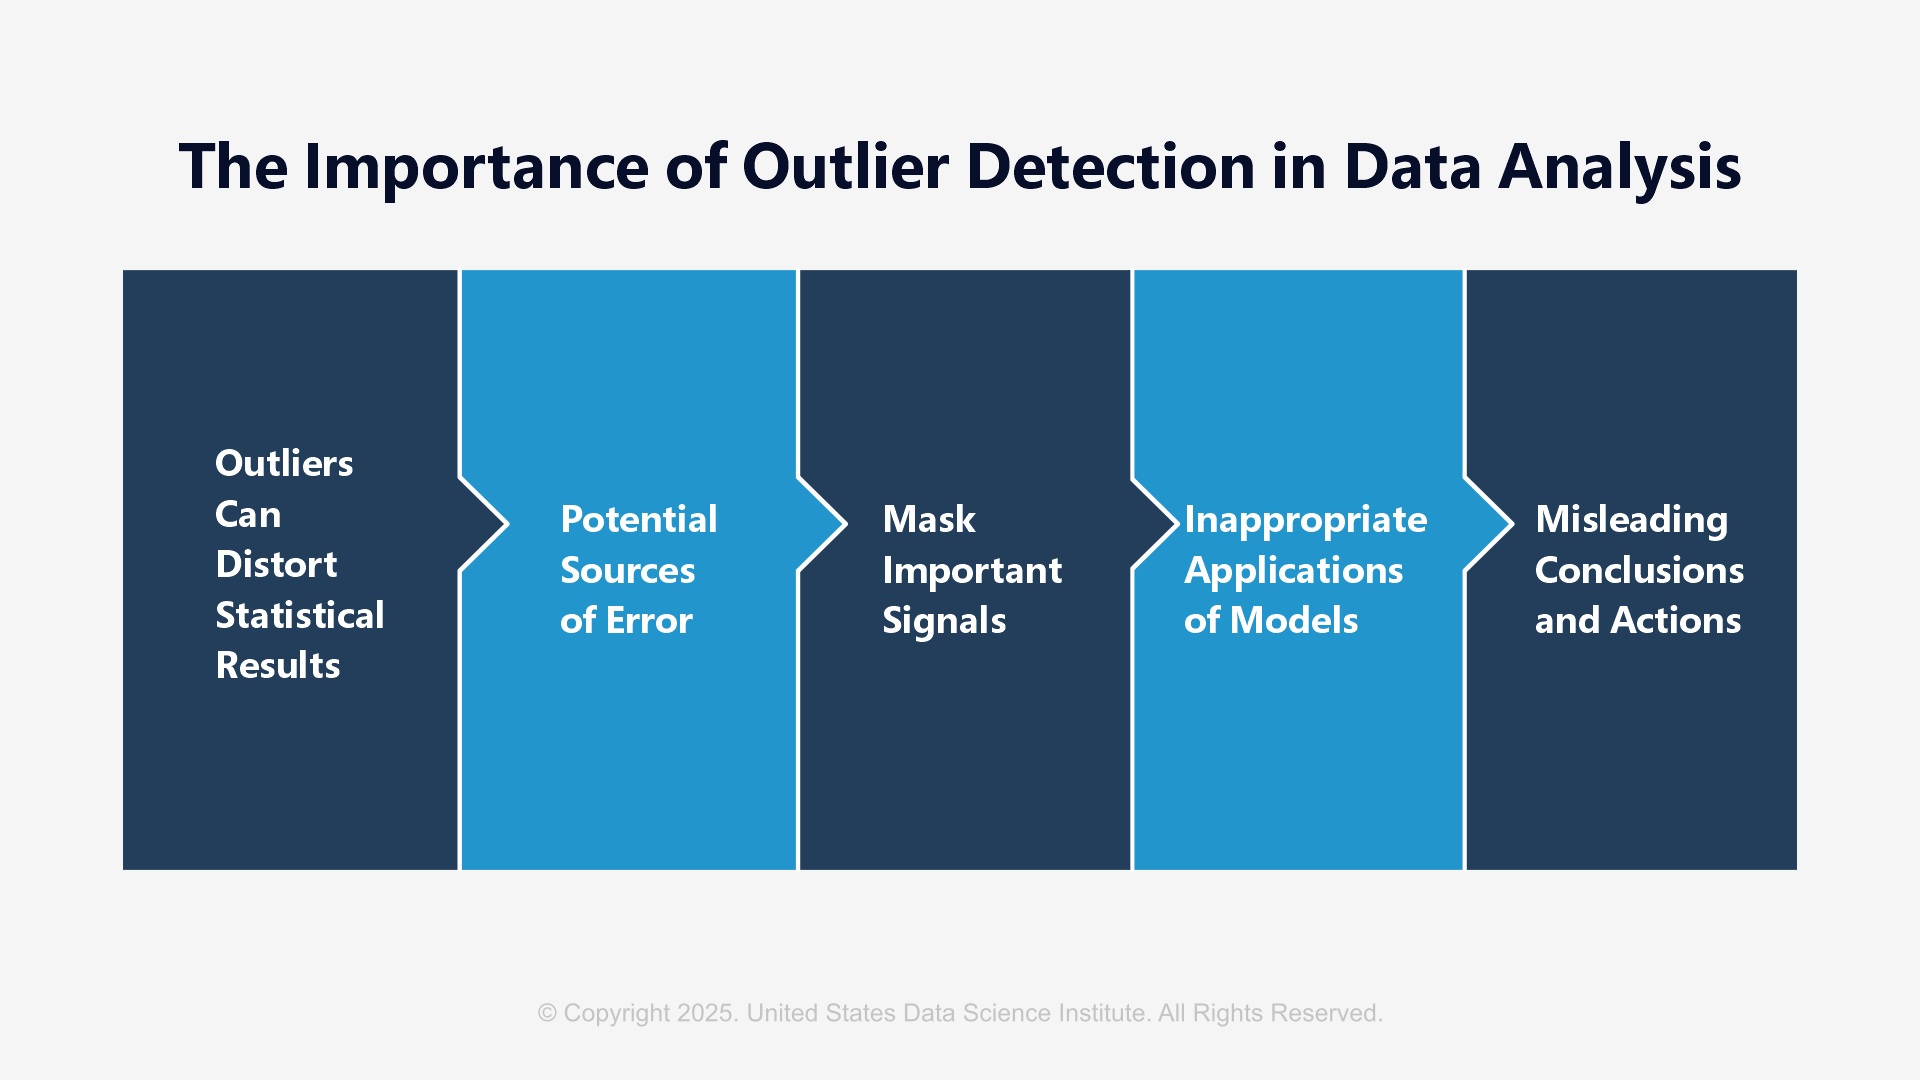
Distorting statistical results to bring forth potential error sources, inappropriate model application, hiding key signals, or delivering misguided decisions are some of the crucial reasons that necessitate outlier detection at the onset. Systematic errors or pattern distortions can widely lead to missed information; that will eventually hamper the health of the overall data-driven decision-making procedures, leading to massive losses in the game.
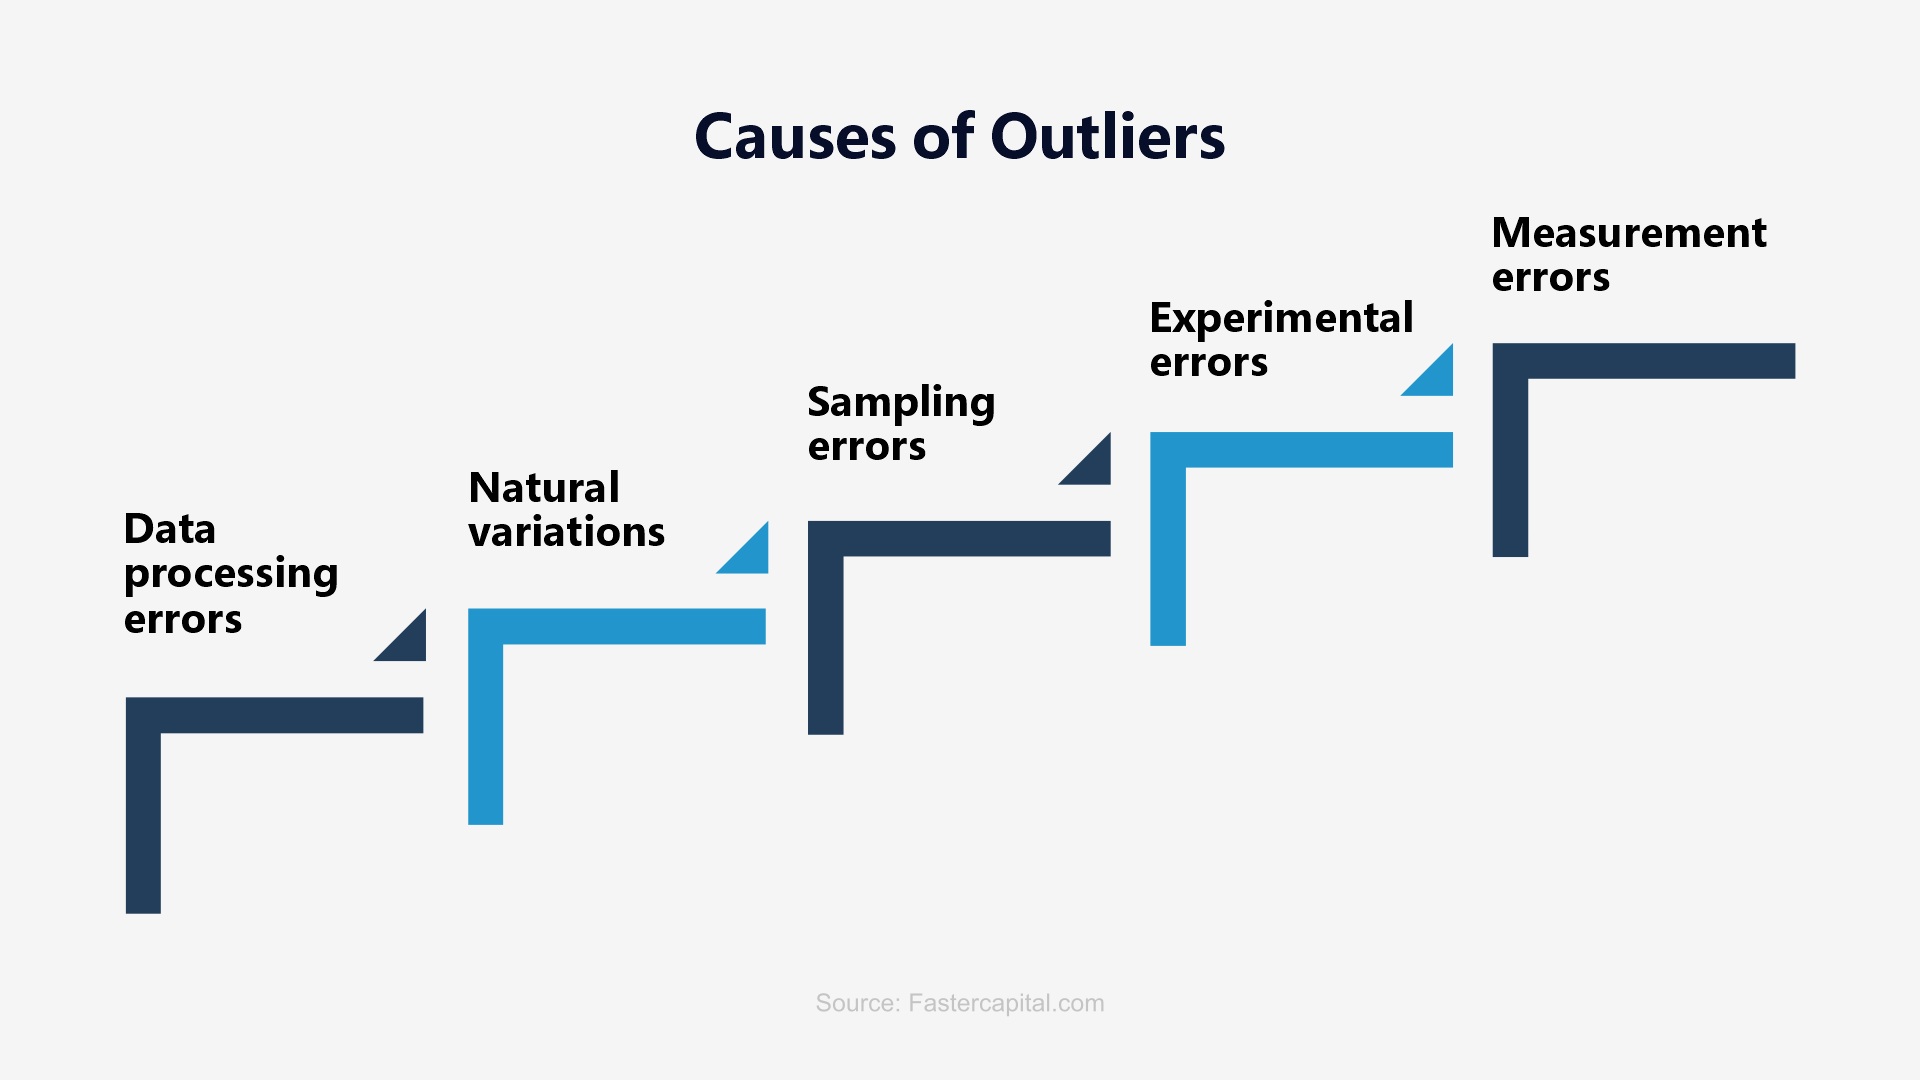
What Causes an Outlier?
Outlier Detection Techniques
Statistical probability forms the basis for detecting any outlier. These models work on the basis that a certain chance is so unlikely to happen that it must be an outlier.
Within this technique, k-Nearest Neighbour (k-NN) is the most used due to its power of showcasing the simplicity of the underlying calculation.
Parametric models overcome the problems of runtime complexity that proximity-based models impose. This renders them as extremely suitable for dealing with Big Data. Popular parametric models are the Minimum Volume Ellipsoid estimation (MVE) and Convex Peeling.
Being the most modern choice, it enables the use of supervised techniques and classification along with unsupervised techniques and clustering.
Strategic Limitations in Applying Outlier Detection Methods
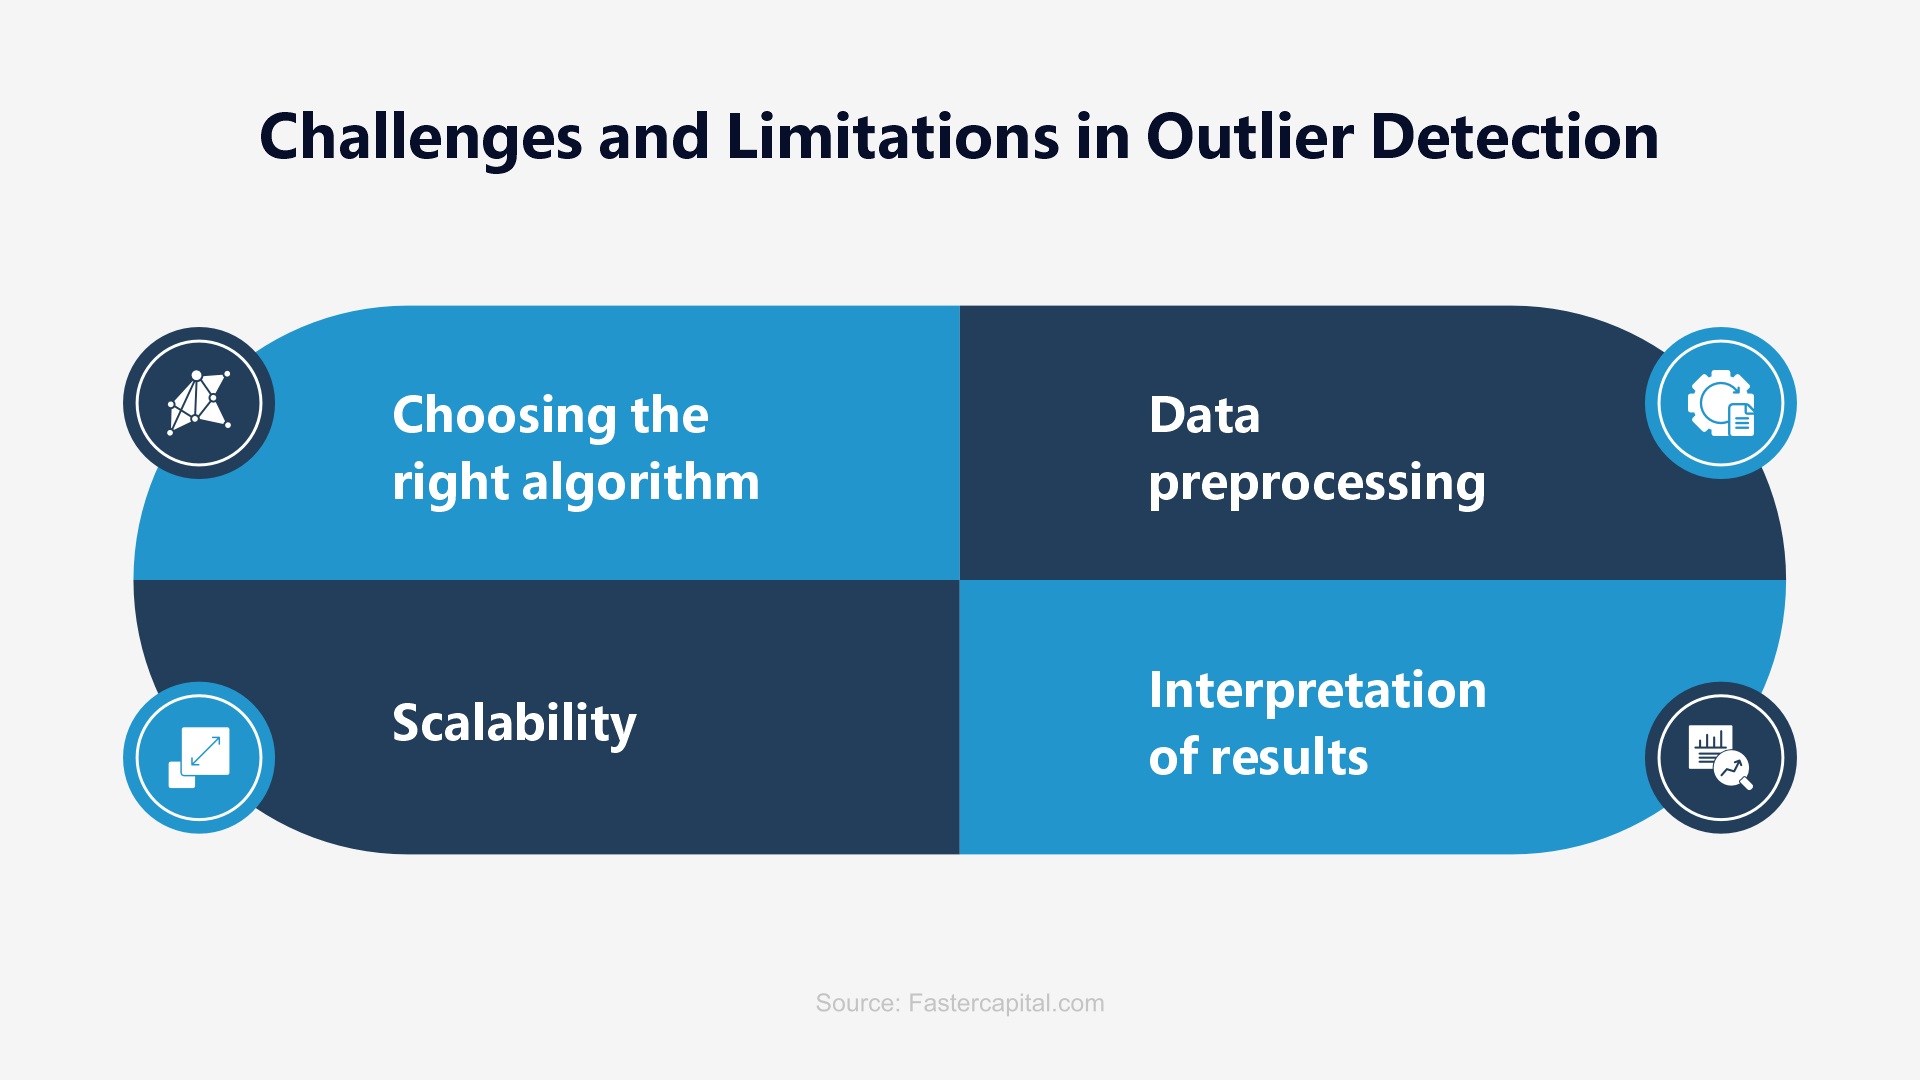
Outlier detection, being the critical step in data mining and transformation, involves identifying and analyzing data points that deviate significantly from the norm. Some of the challenges that must be crushed in the bud include defining outliers at the onset, high-dimensional spaces, data quality issues, data evolution, faulty outlier interpretation, masking and swamping of data, sensitivity and specificity off-balance, cross-integration with other processes, and much more.
Using the Empirical Rule for Outlier Detection
Making detection easier it is expected to understand the Empirical rule that states that for a normal distribution, approximately 68% of data points fall within one standard deviation of the mean, 95% of data points fall within the two standard deviations of the mean, and 99.7% of data points fall within three standard deviations of the mean. Empirical Rule assumes that the data is normally distributed. If not, other methods of outlier detection (Z-scores/ Interquartile Range/ Kurtosis/ Box-plot/ Isolation Forest/ DUBSCAN Clustering) must be used. For more details on outlier detection, explore
Gain an upper hand at understanding outlier detection and make it your strength skill as you go building a lasting career as a data scientist. Understanding futuristic machine learning enhancements, real-time outlier detection, AI integration, Explainable AI for outlier detection, cross-domain outlier detection, and many such trends can leverage meaty career opportunities for you. Unravel and master top skills with the best data science certifications around the world. Begin exploring now!
This website uses cookies to enhance website functionalities and improve your online experience. By clicking Accept or continue browsing this website, you agree to our use of cookies as outlined in our privacy policy.